
The Emission Reduction Scorecard — From Tank Inventory to Prioritised Action Plan
A repeatable method for ranking tanks and emission-control opportunities using emissions, condition, BAT gap, risk, cost and confidence.
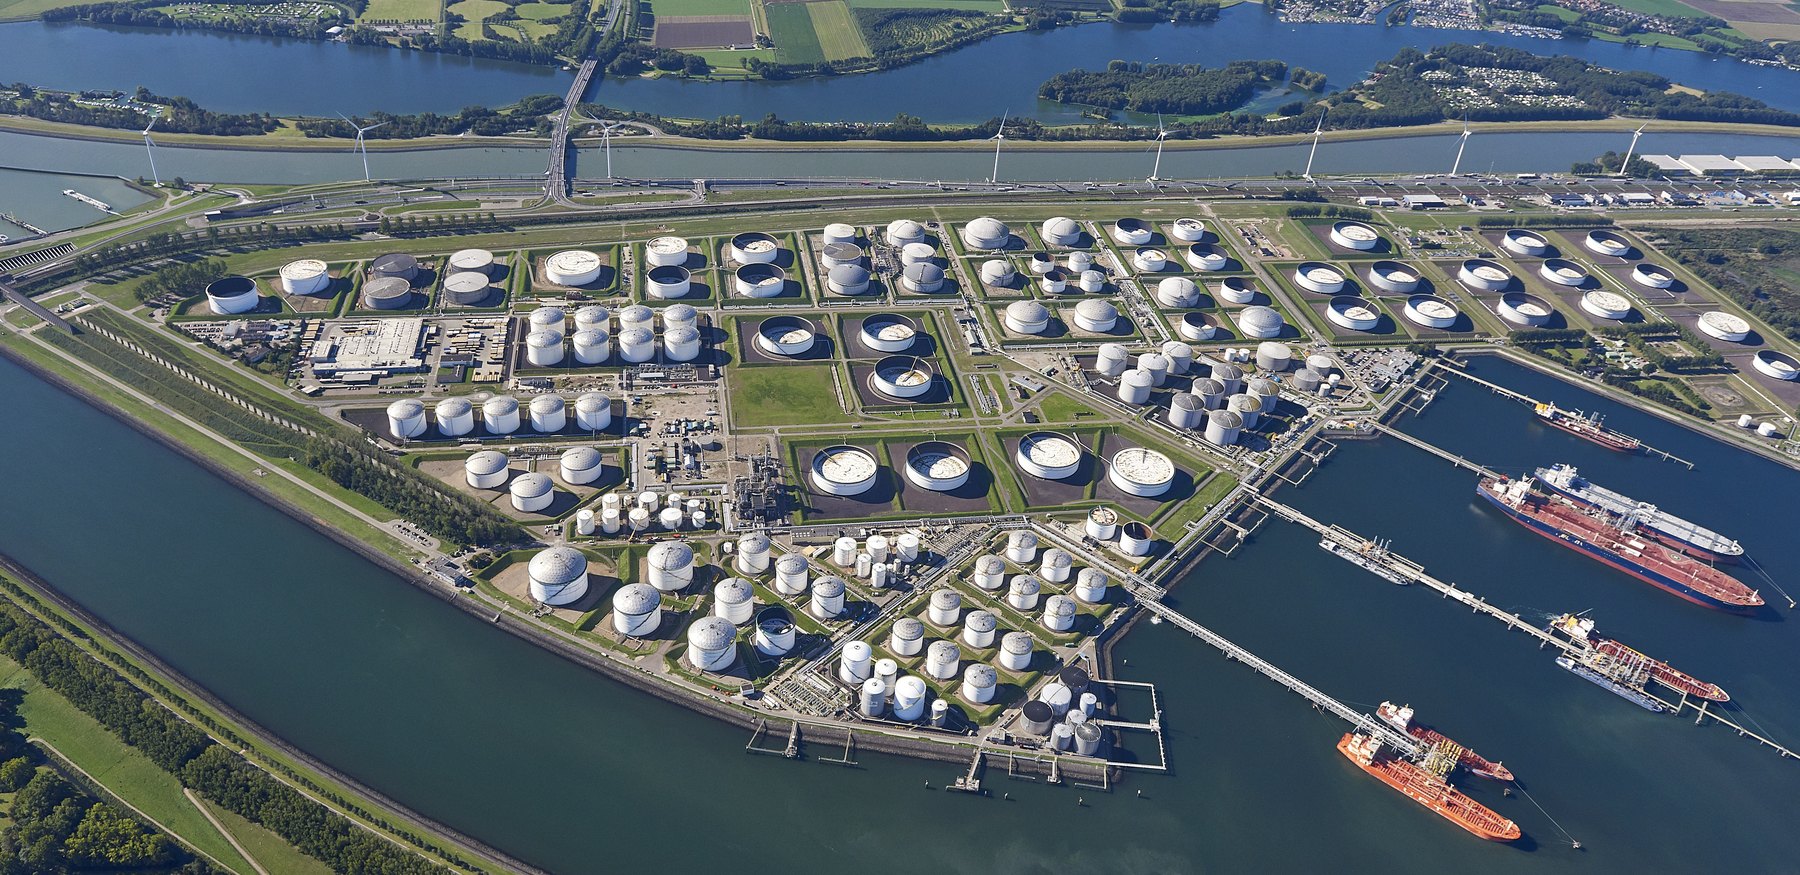
A tank farm rarely needs a single emission-control decision. It needs a programme. Dozens or hundreds of tanks may differ in product, throughput, roof type, seal condition, age, regulatory exposure and outage opportunity. Ranking them only by calculated tonnes of VOC per year can produce a misleading investment sequence.
The Emission Reduction Scorecard is a structured way to convert an inventory into a prioritised action plan. It does not replace engineering judgement; it makes the judgement visible, comparable and auditable.
1. Start with a common data model
Every tank should be described with the same minimum dataset: dimensions, product, temperature basis, throughput, tank and roof type, seal system, deck fittings, venting, landing frequency, current emission estimate, inspection status, known defects, legal or permit constraints and planned outages.
The purpose is not to collect every possible detail before action begins. It is to create enough consistency to identify where missing information itself becomes a priority.
2. The scorecard dimensions
| Dimension | Question | Typical evidence |
|---|---|---|
| Emission magnitude | How large is the current estimated or measured loss? | AP-42 / API MPMS calculation, inventory, measurement |
| Data confidence | How certain is that result? | Product data, inspection recency, measured geometry, known assumptions |
| BAT gap | How far is the current configuration from credible good practice? | Technology review, BREF/EEMUA, permit expectations |
| Physical condition | Are the installed controls actually intact and functional? | Inspection, seal gaps, fittings, OGI, maintenance history |
| Regulatory urgency | Is there a compliance, permit or future-rule driver? | Permit, local rules, project commitments |
| Reduction potential | How much can a realistic intervention remove? | Scenario calculations, tested factors, engineering assessment |
| Implementation complexity | How difficult is the intervention? | Outage, access, hot work, tank modification, interfaces |
| Lifecycle economics | What is the total cost and value over time? | CAPEX, OPEX, product recovery, maintenance, downtime |
| Verification readiness | Can the result be checked after implementation? | Inspection points, monitoring method, test plan |
3. Do not hide uncertainty inside a single number
A scorecard becomes dangerous when the final rank looks more precise than the underlying information. A tank with a high calculated loss but poor product data and an inspection ten years out of date should not be treated as equivalent to a tank with recent field verification.
For that reason, data confidence should be visible as its own score. Low confidence can increase priority for investigation even when the intervention priority is not yet known.
4. Separate diagnosis from solution ranking
The first pass identifies which tanks deserve attention. The second pass compares the feasible control packages for those tanks. Mixing the two stages can bias the ranking toward technologies already familiar to the organisation.
For example, a high-emitting external floating-roof tank may justify a seal repair, a secondary seal, fitting upgrades, a dome conversion, a change in operating practice, or a combination. The scorecard should identify the problem and constraints before a preferred package is selected.
5. Use bands, not fake precision
A practical score can use a 0–5 scale for each dimension with written definitions for every band. Weighting can then reflect the organisation’s objective: regulatory compliance, near-term VOC reduction, product recovery, environmental risk or a balanced portfolio.
The weighting should be published with the result. Changing the weighting is acceptable; changing it invisibly to justify a preferred project is not.
6. Add the outage calendar
Tank-emission projects are often constrained by access. Some seal, deck or structural modifications are most efficient during an out-of-service inspection. A technically attractive project can lose much of its value if it requires an extra tank outage that could have been avoided by coordinating with the integrity plan.
The scorecard should therefore include the next planned inspection or maintenance window. This connects environmental improvement directly to asset management.
7. Track realised performance
A scorecard should not end when a project is approved. After implementation, record the actual configuration, cost, commissioning result, recalculated emissions and any field verification. This creates a feedback loop: expected reduction becomes realised reduction, and future project assumptions improve.
Over time the scorecard becomes a management system rather than a one-off study.
8. Suggested outputs
- A ranked tank list with separate intervention priority and data-confidence ratings.
- A BAT-gap map showing which control layers are missing or degraded.
- A short list of tanks requiring measurement or inspection before a project decision.
- A multi-year CAPEX plan aligned with tank outages.
- A forecast of VOC reduction with uncertainty bands.
- A verification register showing whether completed projects achieved the intended result.
References and technical basis
- US EPA — AP-42 Chapter 7.1, Organic Liquid Storage Tanks (final revision October 2024)
- US EPA — TANKS Emissions Estimation Software, Version 5 (TANKS 5.3 released July 2026)
- EEMUA 213 — Emission reduction from oil storage tanks and loading operations
- European Commission JRC — Emissions from Storage (EFS) BREF, formally adopted July 2006
- EEMUA 159 — Above ground flat bottomed storage tanks: inspection, maintenance and repair
Standards and regulations change. Confirm the edition, legal applicability and permit conditions for the tank, product and jurisdiction before design or compliance decisions are made.